The Problem: Local Agents Don't Scale in a Terminal
When we first shipped Orquesta, the core promise was simple: write a prompt, get a PR. And for a single agent, that worked fine—you'd watch the output scroll by in your terminal. But the moment you asked Claude to refactor a legacy module, run a security audit on a different repo, and generate test coverage for a third, things got messy. Three terminal windows, three separate contexts, zero overview.
By the time you're running 10+ agents—say, parallel code reviews across five microservices, a data migration script, and a bug-hunting agent on production logs—you're not developing anymore. You're a system administrator juggling tmux panes and praying nothing fails silently.
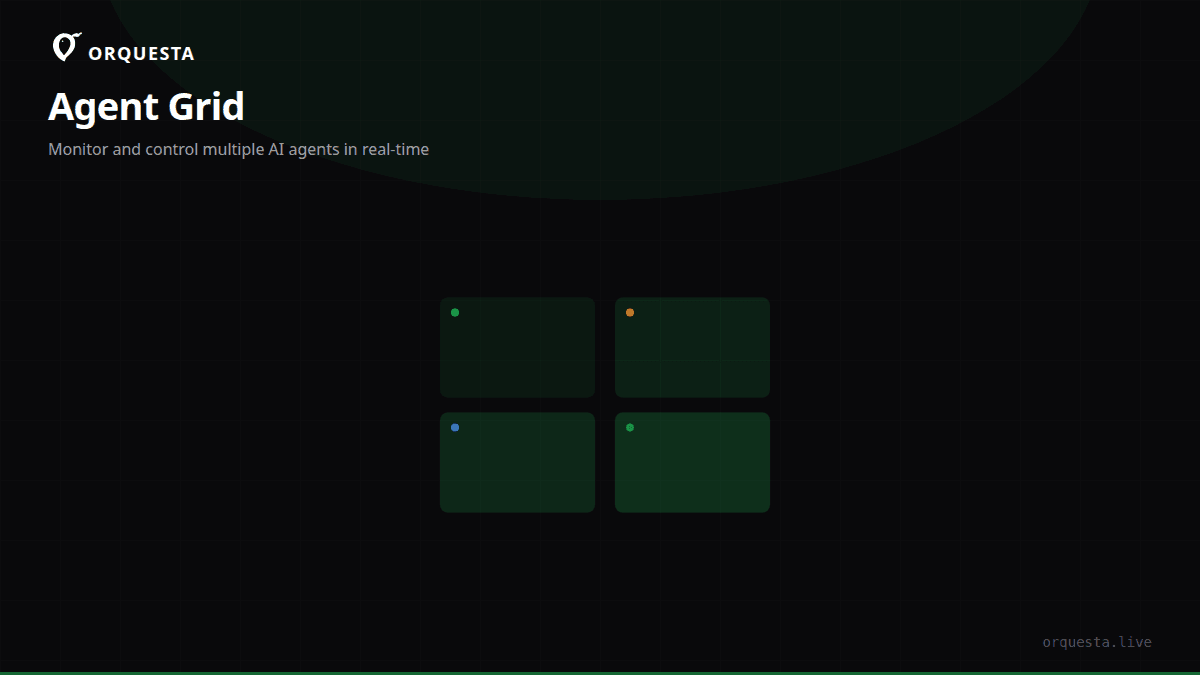
That's why we built Agent Grid. It's not just a fancy dashboard; it's the missing control plane for local AI agents.
Agent Grid's Architecture: One WebSocket, Many Terminals
Agent Grid lives in the Orquesta web app, but the agents themselves run on your machine. Each agent is a process started via the Orquesta CLI, which wraps Claude CLI or any other local LLM runner. The CLI opens a pseudo-TTY (PTY) and streams raw terminal output over a WebSocket connection to the browser. We render that stream with xterm.js, giving you a fully interactive terminal inside the grid—no iframes, no hacks.
The result is that you see every line of output in real time, exactly as if you were sitting in front of that local terminal. But now it's one tab, not 12.
Here's how you launch an agent with grid support:
orquesta agent run "Find security vulnerabilities in the auth service" \
  --mode auto \
  --grid
The --grid flag tells the CLI to attach the agent to the Agent Grid session associated with your login. From any browser, you can watch, interact, and even send new prompts to that agent.
Status Indicators: At a Glance Awareness
A wall of terminals is useless if you can't tell which ones need attention. Each pane in Agent Grid has a status indicator derived from the agent's internal state machine. We track these states:
- Idle – agent is waiting for a prompt or user input.
- Thinking – the LLM is generating a response (streaming tokens).
- Acting – the agent is executing a command, writing files, or making a git commit.
- Needs Input – the agent asked a question and is blocked on a human response.
- Completed – the run finished successfully.
- Error – the run failed with a non-zero exit code.
The indicators are color-coded and visible even when the terminal pane is collapsed. So you can glance at the grid and immediately see: two agents are thinking, one is waiting for your approval, and five have completed. No need to click through each terminal.
Drag to Rearrange: Spatial Memory for Agents
One of the most underrated features is the ability to drag and drop panes. Why? Because when you're monitoring 15 agents, your brain builds a mental map of where things are. The agent fixing the payment bug is in the top left. The code review agent for repo A is bottom right.
A static grid that reorders alphabetically or by start time breaks that mental map every time you refresh. Agent Grid lets you drag any pane to any position, and the layout persists across sessions. We store the layout server-side per user, so when you open the dashboard on your laptop after checking your phone, everything is where you left it.
Under the hood, we use a CSS grid with manual item placement and pointer events for dragging. The drag-and-drop logic is custom—we didn't want a heavyweight library just for moving rectangles. The state updates are batched and sent to the server only when you release the pane, keeping the UI snappy even with dozens of agents.
Column Layouts: Scannable Long-Running Work
Grid mode is great for overview, but when you have agents that output long logs—think a test suite running for 20 minutes—you need vertical real estate. That's where column layouts come in.
Agent Grid supports switching between a 2-column, 3-column, or 4-column layout. Each column is a vertical stack of terminal panes. This is particularly useful when you're running long-lived agents like a Batuta task that's migrating a database, and you want to watch its output scroll while keeping an eye on shorter-lived agents above and below.
We chose to implement column layouts as a simple flexbox arrangement rather than a full grid reflow. It keeps the DOM predictable and allows for smooth transitions when switching layouts.
When You Run 10+ Agents Across Projects
Let's talk about a real scenario. Last week I was preparing a release for one of our internal services. I had:
- 3 code review agents running on different PRs.
- 1 agent generating release notes from commit history.
- 2 Batuta agents running integration tests on staging and production read replicas.
- 1 agent checking for dependency vulnerabilities.
- 4 agents running in parallel on a monorepo to update import paths for a major refactor.
That's 11 agents. Without Agent Grid, that's 11 terminal windows, 11 different contexts, and no way to see if one of them hung. With Agent Grid, I had a single screen with all 11 panes, each showing live output. I could drag the high-priority release blockers to the top, collapse completed agents, and expand the one that needed input. I even noticed a failing test in one of the Batuta agents because its status turned red while I was focusing on another pane.
The key insight is that Agent Grid doesn't just scale to more agents—it scales your attention. You can monitor dozens of agents without context switching because everything is visible at once. And because each agent is a real process on your machine with a real terminal, you can always click into a pane and interact directly if you need to.
The Implementation Details
For those curious about the tech stack: Agent Grid is built with React on the frontend, using xterm.js for terminal emulation and a custom WebSocket client. The backend (part of the Orquesta platform) maintains a registry of active agent sessions and multiplexes terminal streams. We use a pub/sub model: the CLI publishes output chunks to a Redis channel, and the web server subscribes and forwards to the browser. This decouples the CLI from the web socket connection, so if you close your browser, the agent keeps running and you can reconnect later—your layout and history are preserved.
The status indicators are computed by a lightweight state machine that runs inside the CLI process. The CLI emits state transitions over the same WebSocket, so the dashboard updates in real time. We deliberately keep the state machine simple—just the six states I listed earlier—to avoid over-engineering. Anything more complex would require a full agent orchestration engine, which is not the goal here. The goal is visibility.
Takeaway
Agent Grid started as an internal tool to keep our own sanity while dogfooding Orquesta. It turned out to be the feature our users talk about most. The reason is simple: when you run AI agents locally, you're not just running code—you're running a fleet of semi-autonomous processes that need supervision. A terminal window per agent is fine for two or three. For a dozen, you need a control plane. Agent Grid is that control plane, built with the same obsession for real-time, local-first principles as the rest of Orquesta.
If you're managing multiple AI agents across projects, stop juggling terminals. Put them on a grid.