The Problem with Manual Debugging
Every engineer knows the drill: an alert fires, you SSH into a VM, tail logs, run a few commands, stare at stack traces, and eventually find the culprit. Then you fix it, restart the service, and verify. It’s tedious, especially when you’re juggling multiple incidents or it’s 3 AM.
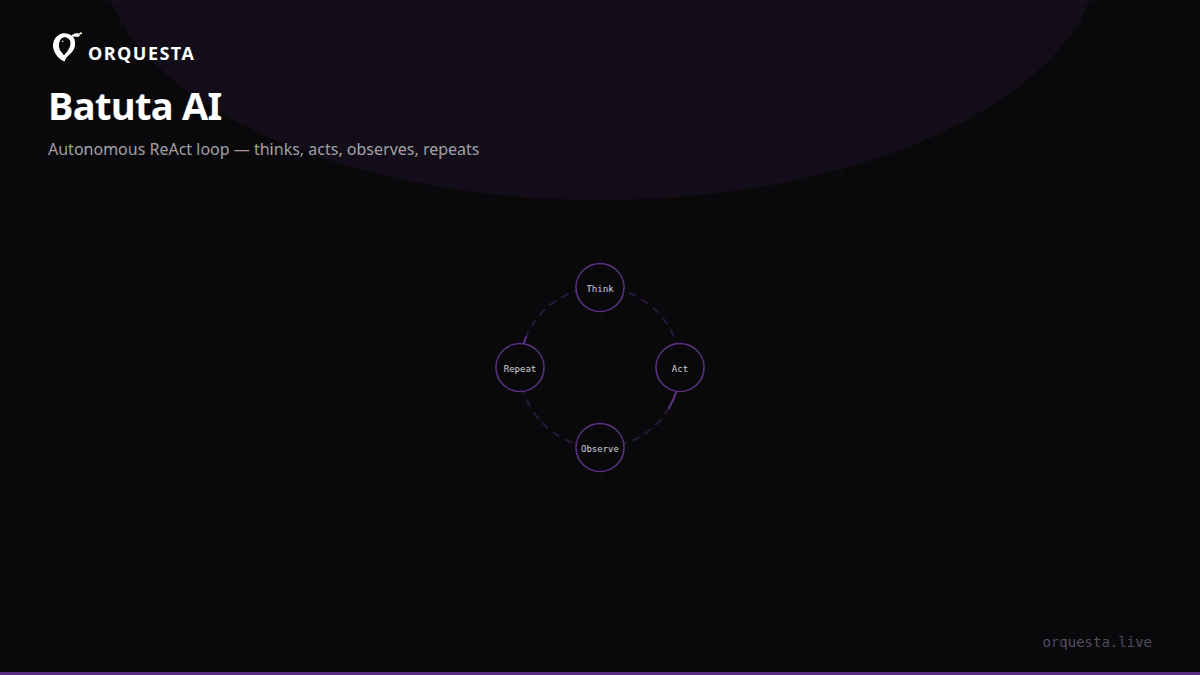
We built Batuta AI to handle this entire loop without human intervention. It’s not a fancy autocomplete or a chatbot—it’s an autonomous agent that connects to your cloud VMs over SSH, reasons about the problem, executes commands, observes results, and iterates until the issue is resolved. Under the hood, it uses a ReAct loop (Think, Act, Observe, Repeat), which we’ve tuned specifically for infrastructure debugging.
The ReAct Loop in Practice
ReAct (Reasoning + Acting) is a prompt engineering pattern where the model first "thinks" about what to do next, then executes an action, observes the output, and uses that observation to decide the next step. Batuta’s implementation is a tight cycle:
- Think – The LLM examines the current state (logs, metrics, previous command outputs) and formulates a hypothesis or a specific diagnostic command.
- Act – It runs that command on the target server via SSH and captures stdout/stderr, exit code, and timing.
- Observe – The output is fed back into the context, along with any new information (file contents, process states).
- Repeat – The model either confirms the hypothesis and takes a corrective action, or tries another diagnostic path.
Unlike a simple script that runs a fixed sequence of commands, Batuta can adapt. If a command fails or returns unexpected output, it pivots. If it needs to inspect a file, it reads it. If it needs to restart a service, it does so and then checks health endpoints. This flexibility is what makes autonomous debugging possible.
How Batuta Connects to Your Cloud VMs
Batuta runs on your own machine (or any host you designate) and uses SSH to connect to target servers. You provide SSH credentials or keys via Orquesta’s secure vault—they never leave your infrastructure. The agent does not operate in a cloud sandbox; everything happens locally, with full control over which servers it can access.
A typical Batuta task begins with a natural language prompt, like:
Batuta, debug why the API service on server api-prod-01 is returning 500 errors on the /users endpoint.
The agent then:
- Resolves the server name (from your inventory or cloud provider tags).
- Establishes an SSH connection using the stored key.
- Starts a ReAct loop: it might first check
systemctl status api, then tail logs, grep for recent errors, inspect configuration, and so on.
All commands are streamed back to Orquesta’s live terminal, so you can watch the reasoning unfold in real time. If you don’t like a step, you can interrupt and redirect.
Real Example: Debugging a Node.js Crash
Let’s walk through a real incident we reproduced internally. A Node.js service kept crashing with ECONNRESET after a deploy. Here’s the condensed ReAct trace:
Think: The service is failing on outbound HTTP calls. Check recent logs for the stack trace.
Act: journalctl -u api -n 200 --no-pager
Observe: Logs show Error: connect ECONNRESET 10.0.1.15:5432 — a database connection issue.
Think: The database might be unreachable or overloaded. Test connectivity from the server.
Act: nc -zv 10.0.1.15 5432
Observe: Connection refused. The database server isn’t listening on that port.
Think: Check if the database process is running on that host.
Act: ssh db-prod-01 'systemctl status postgresql'
Observe: postgresql.service is active but listening only on localhost. The recent deploy may have overwritten postgresql.conf.
Think: Inspect the configuration file for listen_addresses.
Act: ssh db-prod-01 'grep listen_addresses /etc/postgresql/14/main/postgresql.conf'
Observe: listen_addresses = 'localhost' — it should be * or the private IP.
Think: Fix the configuration and restart PostgreSQL.
Act: ssh db-prod-01 'sed -i "s/listen_addresses = .*/listen_addresses = \'*\'/" /etc/postgresql/14/main/postgresql.conf && systemctl restart postgresql'
Observe: Restart successful.
Think: Verify the API service can now reach the database.
Act: nc -zv 10.0.1.15 5432
Observe: Connection succeeded.
Think: Restart the API service and test the /users endpoint.
Act: systemctl restart api && curl -I http://localhost:3000/users
Observe: HTTP 200. Problem resolved.
Batuta then creates a git commit with the configuration change (if the server is managed via configuration files) and posts a summary to the Orquesta dashboard, including the root cause and the exact commands executed.
Real Example: Resolving a Disk Full Incident
Another classic: a server’s disk fills up, causing writes to fail. Batuta was prompted:
Disk usage is at 98% on worker-02. Find large files and clean up safely.
Here’s the condensed flow:
- Think: Check overall disk usage. Act:
df -h /→ Observe:/varis 96% full. - Think: Drill into
/varto find the largest directories. Act:du -sh /var/* | sort -rh | head→ Observe:/var/logis 45G, especially/var/log/nginx. - Think: Check for rotated logs older than 7 days. Act:
find /var/log/nginx -name "*.gz" -mtime +7 -ls→ Observe: Many old access logs gzipped, totaling 30G. - Think: Remove logs older than 7 days, but be careful not to delete current logs. Act:
find /var/log/nginx -name "*.gz" -mtime +7 -delete→ Observe: 30G freed. - Think: Verify disk usage now. Act:
df -h /→ Observe:/vardown to 55%. - Think: Check if any service depends on those old logs (e.g., log shipping). Act:
systemctl status filebeat→ Observe: Filebeat is running but logs a warning about missing old logs. It will continue with new logs only. - Think: No further action needed; report summary.
Batuta handled the whole cleanup without human intervention, including the safety check on log shippers.
Multi-Step Reasoning and Edge Cases
Batuta’s ReAct loop excels at multi-step debugging because it maintains a working memory of the investigation. It can chain together commands, conditionally branch, and even ask for clarification if the prompt is ambiguous. For example, if you say "fix the high CPU on prod", Batuta might first identify the process, then check if it’s a known issue, then apply a patch or roll back a recent deploy—all while keeping you informed.
We’ve also built in safeguards: Batuta will not execute destructive commands (rm -rf, DROP TABLE, etc.) without explicit confirmation. You can configure a deny list of commands, and every action is logged with a full audit trail.
Integration with Orquesta
Batuta is one of four execution modes in Orquesta. When you submit a prompt through the web dashboard, CLI, or Telegram bot, you can choose:
- Auto – AI picks the best mode (usually Batuta for server tasks).
- SSH – Direct one-off command execution.
- Agent – Run Claude CLI for code generation and PRs.
- Batuta – The autonomous SSH agent described here.
All modes stream output into the Agent Grid, where you can monitor dozens of agents in parallel. Quality gates can be applied: before Batuta makes a change, an AI simulation shows the expected diff, and a team lead can approve or reject. Your CLAUDE.md coding standards are automatically synced to every agent run, ensuring consistent practices.
Security and Audit
Since Batuta operates over SSH, security is paramount. SSH keys are encrypted with AES-256 and stored locally; they never leave your machine. Batuta uses the same SSH config as your local environment, so it respects your ~/.ssh/config and known hosts. Every action—prompt, command, output, diff, cost—is recorded in the audit trail, making it easy to review what the agent did and why.
The Takeaway
Batuta AI turns the tedious cycle of SSH debugging into a well-reasoned, autonomous process. By combining the ReAct loop with direct SSH execution, it can handle multi-step incidents—from diagnosing a crashed service to cleaning up disk space—without human hand-holding. We built it to give engineers back their time and reduce mean time to resolution. It’s not magic; it’s a disciplined loop of thinking, acting, and observing, applied relentlessly until the job is done.