You start with one agent. Then two. Before you know it, you have five agents running across three repositories, and you're Alt-Tabbing through terminal windows like a caffeinated sysadmin. I've been there. When we built Orquesta, I was the first user of what became Agent Grid, and I can tell you exactly why it exists.
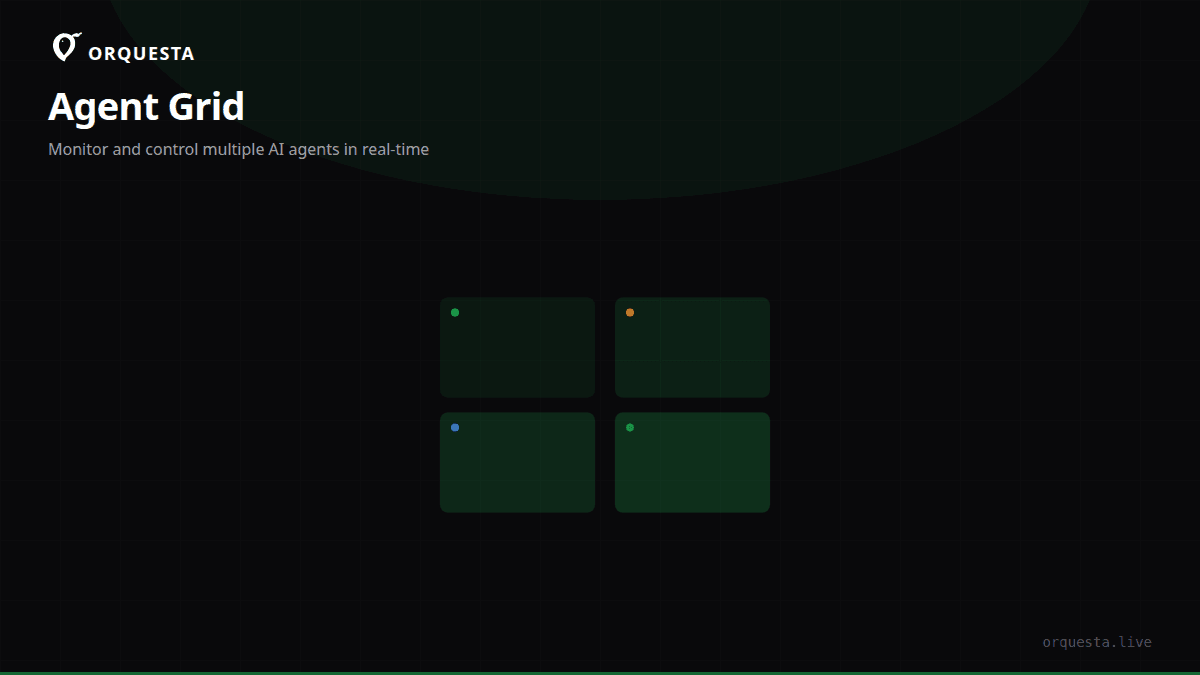
Agent Grid is not a dashboard for dashboards' sake. It's a real-time operational view for every local AI agent you spawn from Orquesta. Think of it as tmux for AI agents, but with a UI that doesn't make your eyes bleed. In this post, I'll walk through how it works under the hood, the design decisions we made, and why it becomes indispensable once you cross the 10-agent threshold.
The Problem: Scaling Beyond One Agent
When you run a single agent that writes code and opens PRs, you can live in its terminal. You watch the output scroll, you see the ReAct loop think, act, observe. But Orquesta's whole premise is that multiple people on your team can submit prompts, and those prompts turn into agents that run on your own machines. That means you might have one agent fixing a bug in your backend, another refactoring the frontend, and a third running tests across a monorepo—all at the same time.
I remember the first week we had five agents running concurrently. I had separate terminal tabs for each, and every time I wanted to check on one, I had to remember which tab was which. Did agent 3 already finish? Why is agent 7 stuck on a dependency install? Was agent 1's last commit pushed? It was chaos.
The obvious answer is a central UI, but the catch is that Orquesta agents run locally. They're Claude CLI processes on your machine. You can't just spin up a cloud dashboard that reads from a shared database—well, you can, but then you lose real-time streaming and the security guarantee of your code never leaving your infra. So Agent Grid had to be built as a local-first real-time view that aggregates all running agent processes on your machine, and optionally syncs encrypted metadata to the cloud for collaboration.
How Agent Grid Works
At its core, Agent Grid is a web UI that reflects the state of every Orquesta agent process on the current machine. When you start an agent—whether through the CLI, the web app, or the Telegram bot—the Orquesta CLI registers that process with a local agent manager. That manager streams stdout and stderr over a WebSocket to the Agent Grid frontend.
Each agent gets a unique session ID. The local manager keeps track of process state (running, exited, error), the working directory, the prompt that initiated it, and cost metrics. The Agent Grid subscribes to the manager's event stream and renders each agent as a tile.
Internally, we use xterm.js for the live terminals. Each tile contains a terminal emulator that connects to the agent's stream. Because we pipe the raw bytes from the agent's PTY, you see exactly what you'd see in a native terminal—colors, control sequences, everything. No sanitized or truncated logs.
Here's a simplified version of how we push terminal data to the grid:
// On the CLI side: spawn the agent process and forward output
const { spawn } = require('child_process');
const agentProcess = spawn('claude', ['--dangerously-skip-permissions', prompt], {
  cwd: projectDir,
  env: { ...process.env, ORQUESTA_AGENT_ID: agentId },
});

agentProcess.stdout.on('data', (data) => {
  broadcastToGrid(agentId, data);
});

agentProcess.stderr.on('data', (data) => {
  broadcastToGrid(agentId, data);
});
Then the grid's terminal component receives these chunks and writes them to the xterm.js instance. We throttle the broadcast to avoid flooding the WebSocket, but in practice, terminal output is bursty enough that this isn't a problem.
Drag-to-Rearrange and Persistent Layouts
One thing I insisted on early was that you shouldn't have to fight the layout. When you have 12 agents running, you need to arrange them in a way that makes sense for your mental model. Maybe you want a 2x6 grid, or maybe you want three columns with specific agents in each. That's why every tile in Agent Grid is draggable.
We built the grid on top of a responsive layout engine that allows drag-and-drop reordering and resizing. When you move a tile, the layout state is saved locally in your browser's localStorage and also synced to your Orquesta profile. So if you close the tab and reopen it, your arrangement is exactly where you left it.
But drag-to-rearrange is only half the story. We also support column layouts: you can choose between a single column (list view), two columns, three columns, or a masonry-style grid. This isn't just aesthetic. When you're monitoring long-running agents that occasionally output a lot, a single column lets you read terminal output easily. When you have many short-lived agents, a dense grid gives you at-a-glance status without scrolling.
I use a three-column layout most of the time. Left column for agents that are executing, middle for agents waiting on review, right for completed agents. That's my operational board.
Status Indicators That Mean Something
Each tile has a status badge, but we didn't want vague colors. A green dot with "Running" is useless if it means 12 different things. So we defined clear states tied to the agent lifecycle:
- Queued: The agent is waiting for a free slot (you can limit concurrent agents).
- Initializing: The Claude CLI is starting, reading project files, and loading CLAUDE.md.
- Executing: The agent is in its ReAct loop—thinking, acting, observing.
- Awaiting Review: The agent has completed its work and opened a PR, waiting for human sign-off.
- Completed: The PR was merged or the task was marked done.
- Failed: The agent exited with an error or was manually stopped.
- Blocked: The agent hit a quality gate and is paused until a team lead resolves the issue.
These states are derived from the agent's internal events, not just process exit codes. For example, an agent in "Awaiting Review" is still technically running because the Claude CLI process is waiting for input, but we know it already created the PR. That distinction matters when you're deciding whether to intervene or let it be.
Hovering over a status badge shows additional metadata: start time, elapsed time, token usage, and cost so far. This is real-time, pulled from the same stream.
Column Layouts for Different Workflows
Column layouts deserve a bit more detail because they're not just for visuals. When you enable the "Group by Status" option, Agent Grid automatically creates columns for each status category. Agents with the same status are grouped together, and you can drag agents between columns to change their state manually (e.g., moving an "Awaiting Review" agent to "Completed" if you already merged the PR).
This grouping is especially useful when you have multiple projects open. Instead of mentally tracking which agents belong to which repo, you get a kanban-like board where each column is a pipeline stage. We didn't set out to build a kanban, but after using it for a week, I realized that's exactly what it had become—and it made our internal review process much smoother.
You can also filter by project, by user, or by prompt keyword. So if you only want to see agents running on the backend repo, you type backend in the filter bar and the grid narrows down. This is crucial when you have 20 agents and need to find a specific one quickly.
Why This Matters at 10+ Agents
Once you cross 10 concurrent agents, the cognitive load becomes the bottleneck. You can't keep 10 terminal tabs in your head. You need a single view that gives you three things: what is each agent doing right now, which ones need my attention, and how much has this cost me.
Agent Grid answers all three. The live terminals show what's happening. The status badges and color coding show which agents are stuck, failed, or waiting. And the per-agent cost display (and total cost in the grid header) keeps you from getting a surprise bill at the end of the month.
But there's a deeper reason this matters. When you run multiple agents across projects, you're not just a developer anymore—you're an orchestrator. You need to manage context, review code, and ensure agents don't step on each other. Agent Grid becomes your mission control. You can watch an agent refactoring authentication while another writes tests, and you can spot the moment one of them goes off the rails.
We've also tied Agent Grid into Orquesta's collaboration features. Team leads can view the grid of agents started by their reports, and they can see quality gate statuses and audit logs without SSHing into someone's machine. This is all done over encrypted channels, with role-based permissions controlling who sees what.
Takeaway
Agent Grid is not a toy. It's the difference between running five agents and running fifty. The live terminals, drag-to-rearrange layouts, granular status indicators, and flexible column views are all designed with one goal: keep you in control when your codebase is being touched by multiple AI agents simultaneously. I built it because I needed it, and now I can't imagine working without it.